背景 🔗
本文主要介绍如何使用 Prometheus 和 Grafana 可视化监控运行在 k8s 上的 Spring Boot 应用,监控指标包括 CPU、内存、线程信息、日志信息、HTTP 请求、JVM 等。
技术方案 🔗
技术方案如下图所示:
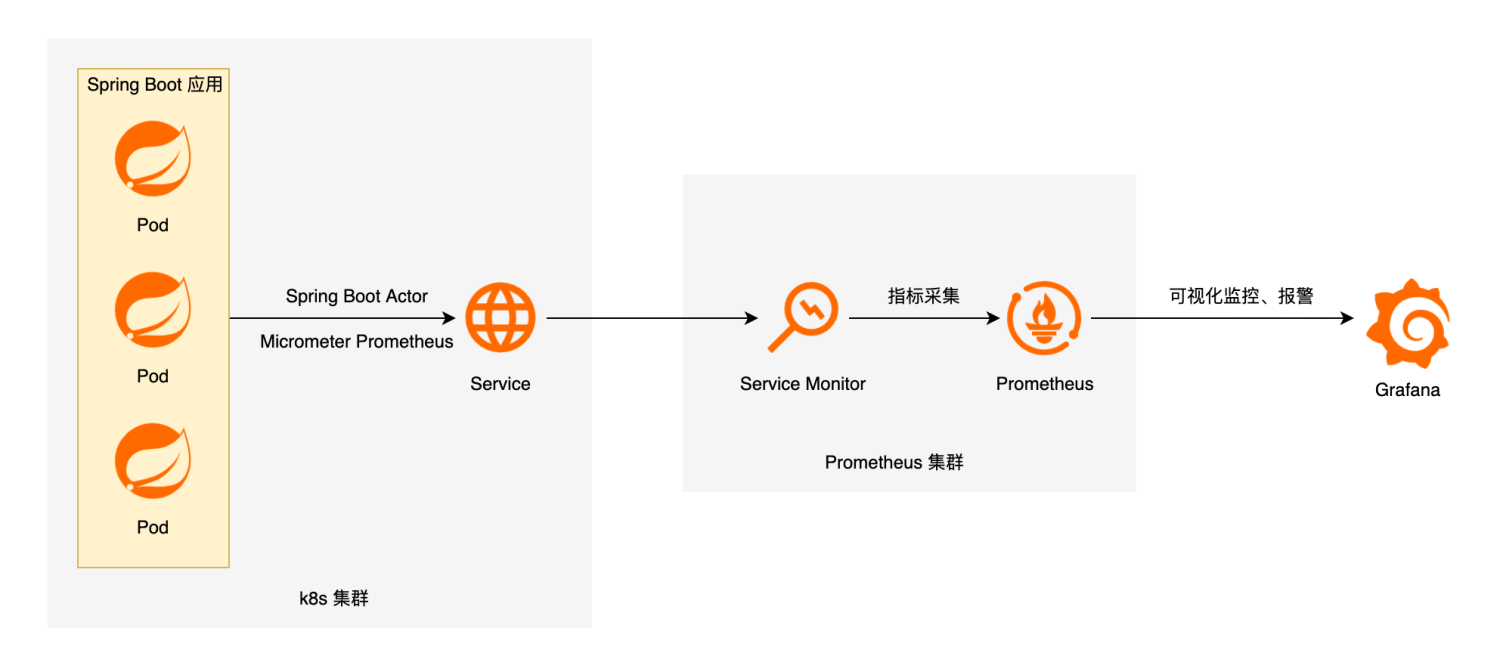
首先我们需要在 Spring Boot 应用中使用 Spring Boot Actuator 监控应用、暴露指标,并使用 Micrometer Prometheus 将 Actuator 监控指标转换为 Prometheus 格式。
Micrometer 为 Java 平台上的性能数据收集提供了一个通用的 API,类似于 SLF4J ,只不过它关注的不是Logging(日志),而是application metrics(应用指标)。 简而言之,它就是应用监控界的SLF4J。
然后在 k8s 集群中,我们需要通过 Service 对外提供 Spring Boot 应用的指标接口。
Prometheus 是一个开源系统监控和警报工具包,可以采集监控指标,并存储为时间序列数据,Prometheus 还提供了灵活的查询语言 PromQL 来查询数据。Prometheus 通过拉模型采集指标,所以我们需要在 Prometheus 集群中配置服务发现(ServiceMonitor)来定期从应用中抓取指标。
Grafana 是一个开源的可视化分析平台,可以用它创建监控仪表盘、配置告警等。
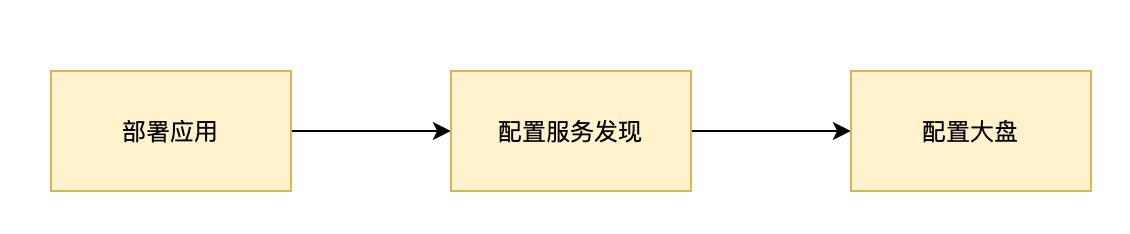
整体个配置流程如下:
部署应用 🔗
应用配置 🔗
在 pom.xml 中添加如下配置:
<!-- 开启 Spring Boot Actuator -->
<dependency>
  <groupId>org.springframework.boot</groupId>
  <artifactId>spring-boot-starter-actuator</artifactId>
</dependency>


<!-- 将 Actuator 指标转换为 Prometheus 格式 -->
<dependency>
  <groupId>io.micrometer</groupId>
  <artifactId>micrometer-registry-prometheus</artifactId>
  <version>${micrometer.version}</version>
</dependency>
然后修改 application.yaml 中添加 Spring Boot Actuator 相关配置:
spring:
  application:
    name: spring-boot-demo

management:
  endpoints:
    web:
      exposure:
        include: "*"
    health:
      show-details: always
  metrics:
    export:
      prometheus:
        enable: true
    tags:
      application: spring-boot-demo
至此,应用配置就完成了,可以通过 /actuator/prometheus 接口查看配置是否正确:
$ curl 'http://localhost:8080/actuator/prometheus' -i -X GET
返回结果如下所示:
HTTP/1.1 200 OK
Content-Type: text/plain;version=0.0.4;charset=utf-8
Content-Length: 2375

# HELP jvm_buffer_memory_used_bytes An estimate of the memory that the Java virtual machine is using for this buffer pool
# TYPE jvm_buffer_memory_used_bytes gauge
jvm_buffer_memory_used_bytes{id="direct",} 489719.0
jvm_buffer_memory_used_bytes{id="mapped",} 0.0
# HELP jvm_memory_committed_bytes The amount of memory in bytes that is committed for the Java virtual machine to use
# TYPE jvm_memory_committed_bytes gauge
jvm_memory_committed_bytes{area="heap",id="PS Survivor Space",} 5.1380224E7
jvm_memory_committed_bytes{area="heap",id="PS Old Gen",} 4.86539264E8
jvm_memory_committed_bytes{area="heap",id="PS Eden Space",} 2.11812352E8
jvm_memory_committed_bytes{area="nonheap",id="Metaspace",} 1.62439168E8
jvm_memory_committed_bytes{area="nonheap",id="Code Cache",} 5.4329344E7
jvm_memory_committed_bytes{area="nonheap",id="Compressed Class Space",} 2.4551424E7
# HELP jvm_buffer_total_capacity_bytes An estimate of the total capacity of the buffers in this pool
# TYPE jvm_buffer_total_capacity_bytes gauge
jvm_buffer_total_capacity_bytes{id="direct",} 489718.0
jvm_buffer_total_capacity_bytes{id="mapped",} 0.0
# HELP jvm_memory_max_bytes The maximum amount of memory in bytes that can be used for memory management
# TYPE jvm_memory_max_bytes gauge
jvm_memory_max_bytes{area="heap",id="PS Survivor Space",} 5.1380224E7
jvm_memory_max_bytes{area="heap",id="PS Old Gen",} 7.16177408E8
jvm_memory_max_bytes{area="heap",id="PS Eden Space",} 2.31735296E8
jvm_memory_max_bytes{area="nonheap",id="Metaspace",} -1.0
jvm_memory_max_bytes{area="nonheap",id="Code Cache",} 2.5165824E8
jvm_memory_max_bytes{area="nonheap",id="Compressed Class Space",} 1.073741824E9
# HELP jvm_buffer_count_buffers An estimate of the number of buffers in the pool
# TYPE jvm_buffer_count_buffers gauge
jvm_buffer_count_buffers{id="direct",} 17.0
jvm_buffer_count_buffers{id="mapped",} 0.0
# HELP jvm_memory_used_bytes The amount of used memory
# TYPE jvm_memory_used_bytes gauge
jvm_memory_used_bytes{area="heap",id="PS Survivor Space",} 5.1139432E7
jvm_memory_used_bytes{area="heap",id="PS Old Gen",} 9.7572216E7
jvm_memory_used_bytes{area="heap",id="PS Eden Space",} 1.47234248E8
jvm_memory_used_bytes{area="nonheap",id="Metaspace",} 1.46403048E8
jvm_memory_used_bytes{area="nonheap",id="Code Cache",} 5.3970112E7
jvm_memory_used_bytes{area="nonheap",id="Compressed Class Space",} 2.1374208E7
配置 Service 🔗
因为应用是部署在 k8s 上的,由多个 Pod 组成,所以还需要为 Pod 添加 Service,对外提供 HTTP 服务,这样 Prometheus 才可以抓取监控指标。
在 k8s 中添加类似下面的 Service:
apiVersion: v1
kind: Service
metadata:
  labels:
    app: spring-boot-demo-exporter
  name: spring-boot-demo-exporter
  namespace: default
spec:
  ports:
    - name: spring-boot-demo-exporter
      port: 8080
      protocol: TCP
      targetPort: 8080
  selector:
    app: spring-boot-demo
  type: NodePort
需要注意 spec.selector 需要与 Pod 的标签对应。例如使用 Deployment 部署应用,则需要与 Deployment 的 spec.template.metadata.labels 对应,这样 Service 才能知道对应的 Pod。
配置服务发现 🔗
如果使用的是自己部署的 Prometheus 服务,则可以在 prometheus.yml 中添加上 Service 对应的任务,例如:
scrape_configs:
  # ...
  -  job_name: 'spring-boot-demo' # Prometheus 任务名称,自定义
     metrics_path: '/actuator/prometheus' # 指标获取路径
     scrape_interval: 5s # 抓取指标的间隔时间
     static_configs:
       - targets: ['spring-boot-demo-exporter:8080'] # 指标访问入口,即 k8s 集群的 Service
如果使用的是云厂商提供的 Prometheus 服务,则需要安装云厂商的规则添加服务发现。如 阿里云 Prometheus 监控 的 ServiceMonitor 配置如下:
apiVersion: monitoring.coreos.com/v1
kind: ServiceMonitor
metadata:
  name: spring-boot-exporter
  namespace: default
spec:
  endpoints:
  - interval: 30s
    # Prometheus Exporter 对应的 Path 的值
    path: /actuator/prometheus
    # service.yaml 中 Prometheus Exporter 对应的 Port 的 Name 字段的值
    port: spring-boot-exporter
  namespaceSelector:
    any: true
  selector:
    matchLabels:
      # service.yaml 的 Label 字段的值以定位目标 service.yaml
      app: spring-boot-demo-exporter
需要注意的是,spec.selector.matchLabels 需要与应用 Service 中的 spec.ports[].name 对应。
配置大盘 🔗
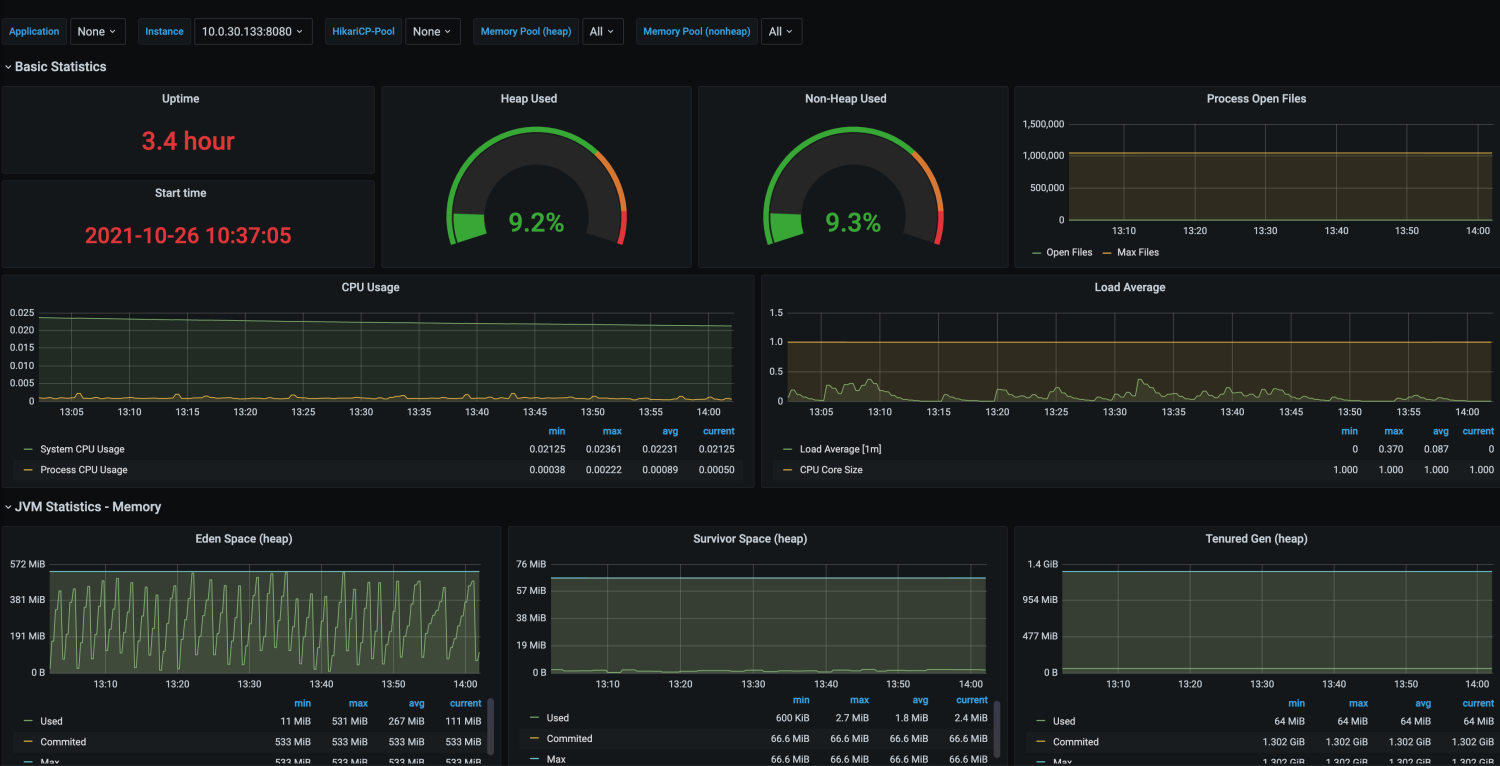
Grafana 提供了丰富的大盘模板,可以在其官网搜索合适的大盘导入到自己的 Grafana 监控中。
我使用的是这两个大盘:
- Spring Boot 2.1 Statistics 监控 Spring Boot 应用
- SLS JVM监控大盘 监控 JVM
最终效果预览如下:
总结 🔗
至此,基于 Prometheus + Grafana 的 Spring Boot 应用监控系统就创建完成了。接下来还可以使用 Grafana 实现告警,这类就不赘述了。